2026 · June
AI-Quantified Bone Marrow Biomarkers in the MOST MPN Study

Len Brandes
Machine Learning Scientist
At EHA 2026 in Stockholm, we presented work with Incyte applying two of our digital-pathology algorithms—Continuous Indexing of Fibrosis (CIF) and Megakaryocyte Characterization (MC)—to bone marrow biopsies from the MOST study, a large longitudinal cohort in myeloproliferative neoplasms (MPN).
Together they turn a biopsy into continuous, objective measurements. CIF tracked the pathologist-assigned fibrosis grade while exposing the variation hidden within each grade, and a higher baseline fibrosis score predicted disease progression even among patients enrolled as lower risk.
These are the kind of sensitive, reproducible tissue readouts that trials need to show whether a therapy is modifying the disease itself, not only controlling its symptoms.
Why MPN trials need quantitative bone marrow readouts
Under European LeukemiaNet and IWG-MRT response criteria, complete remission in essential thrombocythemia (ET) and myelofibrosis (MF) requires a bone marrow histological response—resolution of the abnormal megakaryocytes and fibrosis—not only improvement in blood counts and symptoms. Assessing that today means a pathologist manually grading fibrosis and inspecting megakaryocytes by eye—an assessment that is categorical, subjective, and without an empirical standard.
Measuring disease modification calls for readouts that are continuous rather than banded, reproducible across centers and time-points, and scalable to a whole cohort. We built CIF and MC to provide exactly that, directly from the slide.
Two readouts from a bone marrow biopsy
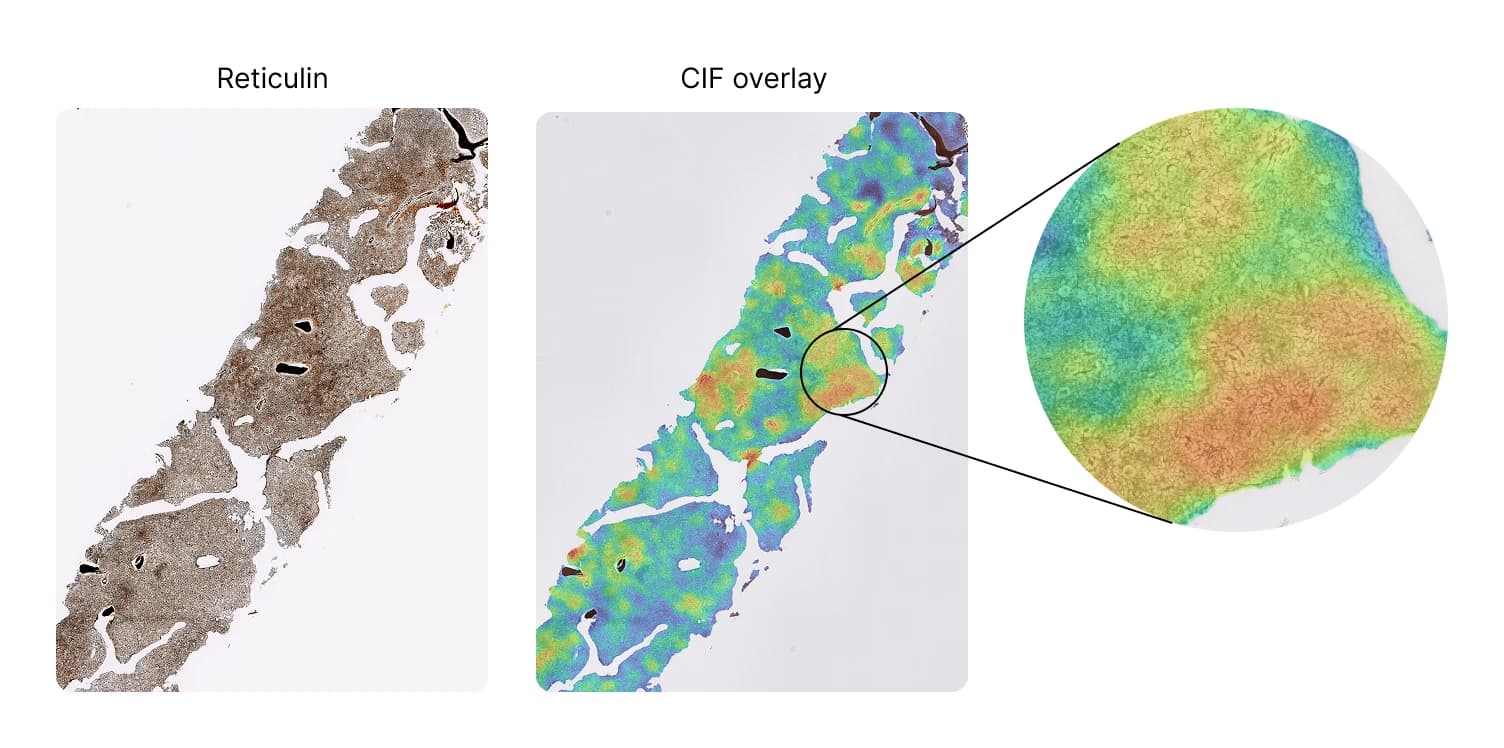
CIF measures fibrosis continuously and in space. It assigns a score between 0 and 1 to every microscopic patch of a reticulin-stained slide, producing a heatmap of where fibrosis sits across the tissue; the slide-level score is the mean of the most-affected regions. In place of a single grade, this gives both a number and a map. The method is described and validated in HemaSphere (2024).
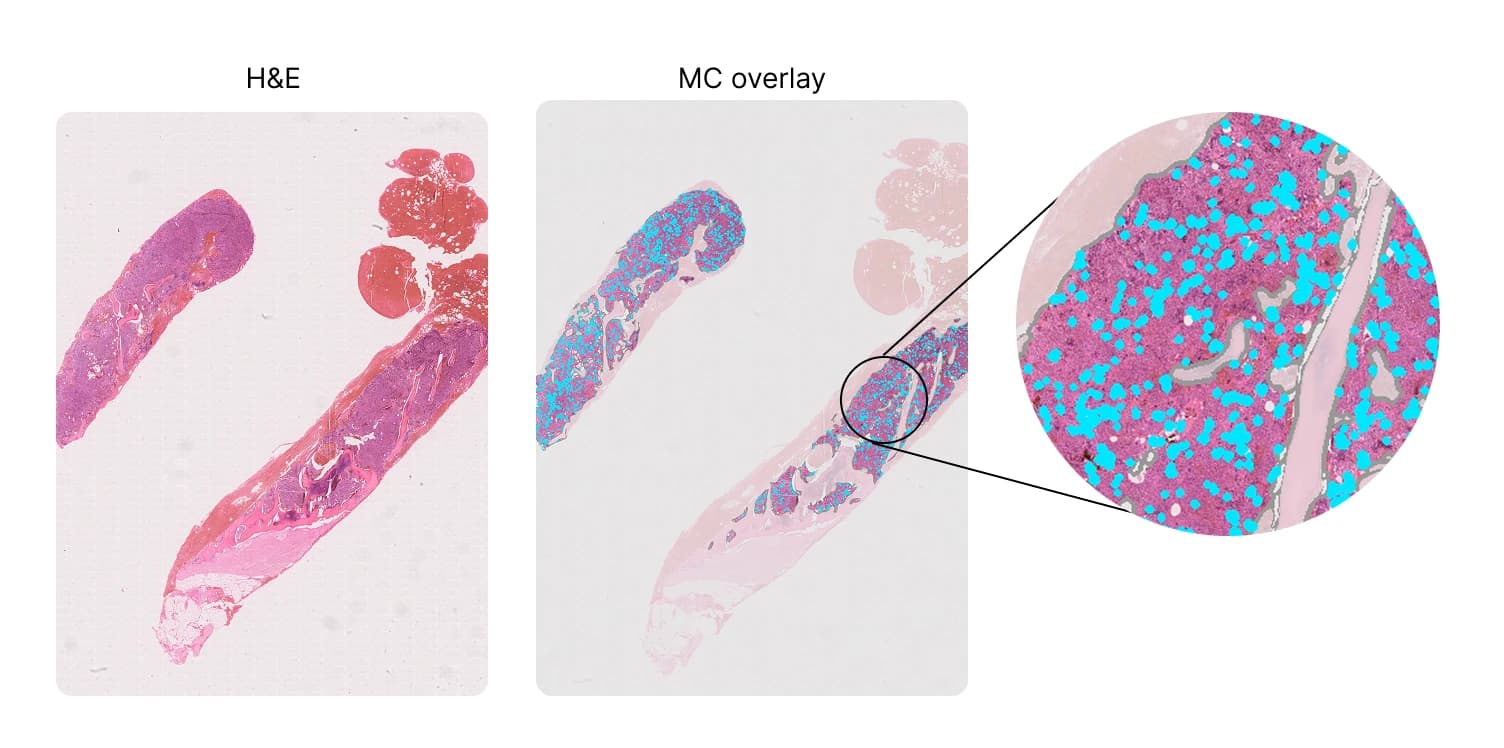
MC works from the standard H&E slide. It detects and segments every megakaryocyte—the large, platelet-producing cells whose size and arrangement carry diagnostic weight—and characterizes their morphology and spatial arrangement across the whole slide. Here we focus on two such measures: pleomorphism, the variability in cell size, and clustering, the fraction of megakaryocytes sitting in groups of three or more.
The MOST study
MOST (NCT02953704) is a longitudinal, observational study of US patients with high-risk ET or lower-risk MF, followed here for a median of 4.8 years. From roughly 1,200 enrolled patients we analyzed the whole-slide images available for histology: 136 reticulin-stained biopsies for CIF and 148 H&E-stained biopsies for MC, spanning both ET and MF.
To read these numbers in context, we compared them against a large multicenter reference cohort assembled from more than ten referral centers, covering normal, ET, and MF bone marrow. The reference gives a backdrop of what fibrosis and megakaryocyte morphology look like across the disease spectrum, against which the MOST cohort can be placed.
What we found
CIF tracks fibrosis grade, and resolves what it hides
CIF agreed closely with the pathologist-assigned WHO fibrosis grade (Spearman ρ = 0.870, P < 0.001, n = 136). More usefully, it did not simply reproduce the grade: within any single WHO grade, CIF revealed substantial, continuous variation in fibrosis—the kind of heterogeneity that categorical grading collapses into one band.
The MOST cohort sits where its design predicts
Placed against the reference cohort, the MOST samples fell where their enrollment criteria would suggest. Fibrosis was markedly lower in MOST MF patients than in the reference MF cohort (median CIF 0.40 vs 0.74; P < 0.001), consistent with enrollment of lower-risk MF. Megakaryocyte pleomorphism and clustering, by contrast, matched the disease-specific reference cohorts (P > 0.2) and were clearly elevated above normal marrow (P < 0.001).
Fibrosis predicts progression, and tracks molecular burden
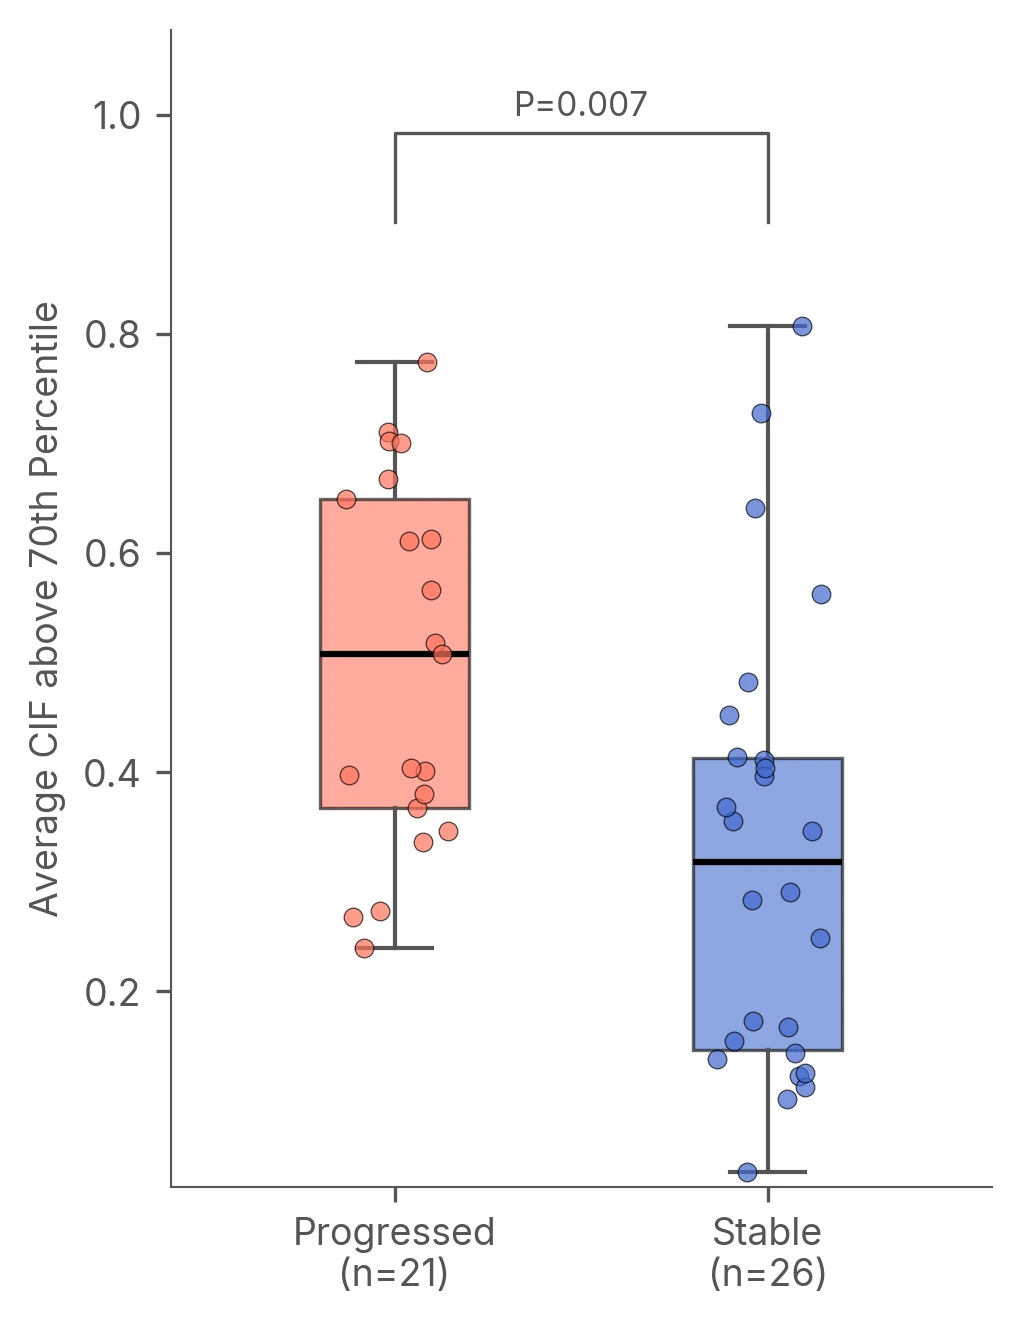
A higher baseline CIF score predicted later disease progression, even in this lower-risk population (median CIF 0.51 in patients who progressed vs 0.32 in those who remained stable; P = 0.007; mean time to progression 23.1 months). Progression here was a clinically defined worsening of disease—falling hemoglobin or platelets, rising blasts or white-cell counts, leukemic transformation, or a physician-reported event—rather than a change in histological grade. Both CIF and megakaryocyte clustering rose with molecular driver burden, correlating positively with JAK2 and CALR variant allele frequency across ET and MF.
Toward trial-ready biomarkers
Read together, these results show CIF and MC behaving as the kind of biomarkers MPN trials need: continuous, objective, reproducible at multicenter scale, and able to separate normal marrow from disease. CIF matches the established fibrosis grade while adding resolution within it and a signal about what comes next; MC measures megakaryocyte morphology cell by cell across the whole slide—a level of detail far beyond the quick, qualitative impression a pathologist can realistically form by eye, which would otherwise demand hours of manual assessment per slide.
Most importantly, both move beyond a static grade toward something that can be measured repeatedly over the course of treatment—a prerequisite for showing that a therapy is changing the underlying disease. We are continuing to develop and validate these readouts in MPN and beyond. If a quantitative bone marrow readout sits on the critical path for a therapy you are developing, we would be glad to talk.
Presented at the European Hematology Association (EHA) 2026 Congress, Stockholm, Sweden, June 11–14, 2026 (PS1961).